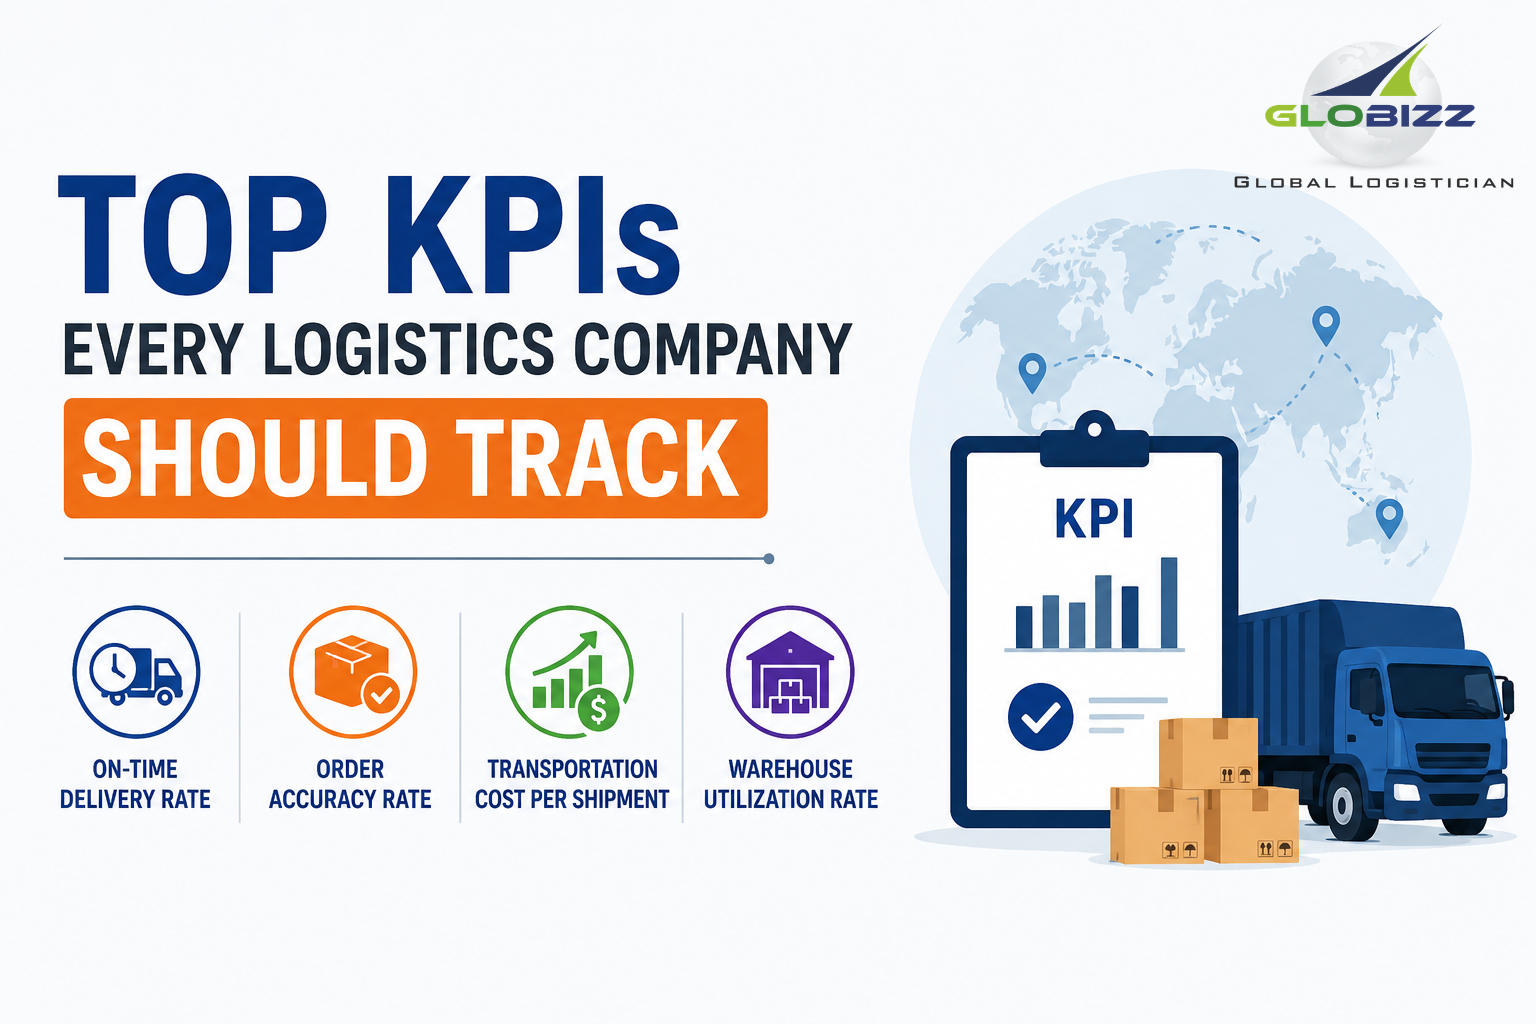
In today’s fast-moving logistics industry, success depends on more than just moving goods from one place to another. Companies must deliver faster, reduce operational costs, improve customer satisfaction, and maintain supply chain visibility. To achieve this, tracking the right Key Performance Indicators (KPIs) is essential.
KPIs help logistics companies measure performance, identify inefficiencies, and make data-driven decisions. Whether you operate in freight forwarding, warehousing, transportation, or supply chain management, monitoring logistics KPIs can significantly improve operational efficiency and profitability.
Here are the top logistics KPIs every company should track in 2026.
1. On-Time Delivery Rate
On-time delivery is one of the most important KPIs in logistics. Customers expect shipments to arrive as promised, and delays can damage trust and brand reputation.
Formula:
(Number of On-Time Deliveries ÷ Total Deliveries) × 100
Why It Matters:
- Improves customer satisfaction
- Builds long-term client relationships
- Reduces customer complaints
- Enhances service reliability
A high on-time delivery rate indicates efficient route planning, warehouse coordination, and transportation management.
2. Order Accuracy Rate
Order accuracy measures how correctly orders are picked, packed, and delivered without errors.
Formula:
(Accurate Orders ÷ Total Orders) × 100
Why It Matters:
- Reduces returns and replacement costs
- Improves customer trust
- Minimizes warehouse errors
- Enhances operational efficiency
Even small order mistakes can increase logistics costs and negatively affect customer experience.
3. Transportation Cost per Shipment
Transportation expenses are a major part of logistics operations. Tracking cost per shipment helps companies control spending and improve profitability.
Formula:
Total Transportation Cost ÷ Total Number of Shipments
Why It Matters:
- Helps optimize delivery routes
- Identifies unnecessary expenses
- Supports better pricing strategies
- Improves cost efficiency
Companies can reduce transportation costs by using route optimization software and load planning systems.
4. Inventory Turnover Ratio
Inventory turnover measures how quickly inventory is sold and replaced within a specific period.
Formula:
Cost of Goods Sold ÷ Average Inventory
Why It Matters:
- Prevents overstocking
- Reduces storage costs
- Improves cash flow
- Increases warehouse efficiency
A low inventory turnover ratio may indicate poor demand forecasting or excess stock.
5. Warehouse Utilization Rate
Warehouse utilization shows how effectively storage space is being used.
Formula:
(Used Warehouse Space ÷ Total Warehouse Space) × 100
Why It Matters:
- Maximizes storage efficiency
- Reduces operational waste
- Improves warehouse planning
- Enhances inventory management
Smart warehouse layouts and automation tools can help improve space utilization.
6. Freight Damage Rate
Freight damage rate tracks the percentage of goods damaged during transportation or handling.
Formula:
(Damaged Shipments ÷ Total Shipments) × 100
Why It Matters:
- Reduces financial losses
- Improves customer satisfaction
- Identifies packaging or handling issues
- Protects company reputation
Monitoring this KPI helps businesses improve packaging standards and handling procedures.
7. Perfect Order Rate
Perfect order rate measures orders delivered without delays, damages, or documentation errors.
Formula:
(Perfect Orders ÷ Total Orders) × 100
Why It Matters:
- Reflects overall logistics performance
- Combines multiple operational metrics
- Improves customer retention
- Enhances supply chain reliability
A higher perfect order rate indicates strong coordination across warehousing, transportation, and customer service.
8. Average Delivery Time
This KPI measures the average time taken to deliver goods from dispatch to final delivery.
Why It Matters:
- Helps improve delivery speed
- Enhances customer experience
- Supports route optimization
- Identifies supply chain bottlenecks
With growing e-commerce demand, faster delivery times are becoming a competitive advantage.
9. Return Rate
Return rate measures how many products are returned by customers due to incorrect shipments, damages, or quality issues.
Formula:
(Returned Orders ÷ Total Orders) × 100
Why It Matters:
- Reduces reverse logistics costs
- Improves product handling
- Enhances order accuracy
- Identifies operational issues
A high return rate often signals problems in warehousing, packaging, or transportation.
10. Customer Satisfaction Score (CSAT)
Customer satisfaction is a critical KPI for logistics companies aiming to retain clients and build long-term relationships.
Why It Matters:
- Measures service quality
- Helps improve customer experience
- Increases client retention
- Strengthens brand reputation
Feedback surveys and customer reviews are useful tools for measuring satisfaction levels.
11. Fleet Utilization Rate
Fleet utilization measures how effectively vehicles are being used.
Formula:
(Active Vehicle Time ÷ Total Available Vehicle Time) × 100
Why It Matters:
- Reduces idle time
- Improves fuel efficiency
- Maximizes transportation productivity
- Lowers operational costs
Efficient fleet management helps logistics companies improve profitability and service performance.
12. Supply Chain Visibility
Modern logistics relies heavily on real-time visibility. This KPI measures how effectively companies can track shipments, inventory, and operational data.
Why It Matters:
- Improves decision-making
- Reduces delays and disruptions
- Enhances transparency
- Supports proactive problem-solving
Technologies like IoT, GPS tracking, and AI-powered analytics are helping companies achieve better supply chain visibility.
Final Thoughts
Tracking the right logistics KPIs is essential for improving operational performance, reducing costs, and enhancing customer satisfaction. In 2026, logistics companies that use real-time data and performance metrics will have a significant competitive advantage.
From on-time delivery and inventory turnover to fleet utilization and customer satisfaction, these KPIs provide valuable insights into every stage of the supply chain.
Businesses that regularly analyze and optimize these metrics can build more resilient, efficient, and customer-focused logistics operations in an increasingly competitive global market.